肿瘤NGS检测开发过程中的方法学
- 李金明,高通量测序技术[M].
- 李金明,个体化医疗中的临床分子诊断[M].
- Rehm H L, et al. ACMG clinical laboratory standards for next-generation sequencing[J] 2013.
- Aziz N, et al. College of American Pathologists’ laboratory standards for next-generation sequencing clinical tests[J] 2015.
- Matthijs G, et al. Guidelines for diagnostic next-generation sequencing[J] 2016.
- Jennings L J, et al. Guidelines for validation of next-generation sequencing–based oncology panels[J] 2017.
- Li M M, et al. Standards and guidelines for the interpretation and reporting of sequence variants in cancer[J] 2017.
- Roy S, et al. Standards and guidelines for validating next-generation sequencing bioinformatics pipelines[J] 2018.
产品开发过程中的深度确定
测序深度或覆盖深度被定义为覆盖给定核苷酸位置的reads的数量,生物信息学工具极其依赖于足够的覆盖深度,以便灵敏和特异地检测变异。覆盖深度与稳定检测样本的变异之间的关系很简单,因为更高数量的高质量测序数据为特定位置的碱基检测供了信心,无论来自测序样本的碱基调用是否是与参考碱基相同(未识别出变异)或者是非参考碱基(识别出变异)。 然而,许多因素会影响所需的深度,包括测序平台,目标区域的序列复杂性(与基因组的多个区域具有同源性的区域、重复序列元件或假基因的存在以及GC富集区域)。此外,用于目标富集的文库制备和需要评估的变异类型也是重要的考虑因素。因此,必须在检测开发和验证过程中系统地评估每个 NGS 测试的覆盖模型。
这些性能参数可以并且应该在开发阶段进行评估,以帮助定义验证的接受标准。例如,对于给定比例的突变等位基因,可以使用二项分布方程来确定检测到最小数量等位基因的概率: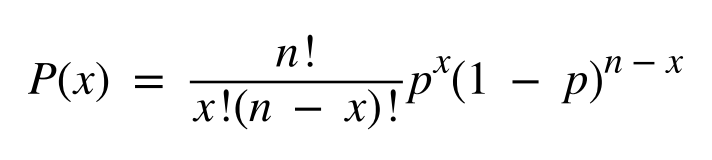
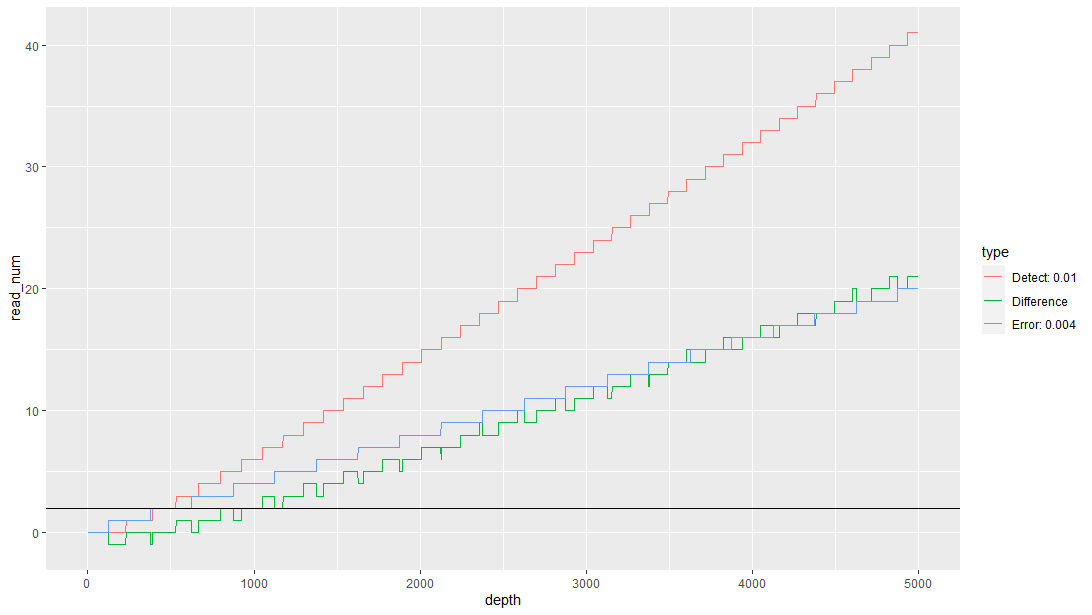
而在一个确定的检测体系下,我们可以知道一个体系的错误率(LOB),和预期的检测限。这时我们可以根据所需的检测下限、读取质量和假阳性或假阴性结果的容忍度来估计所需的覆盖深度(可以游有效区分真阳性和真阴性的最低深度)。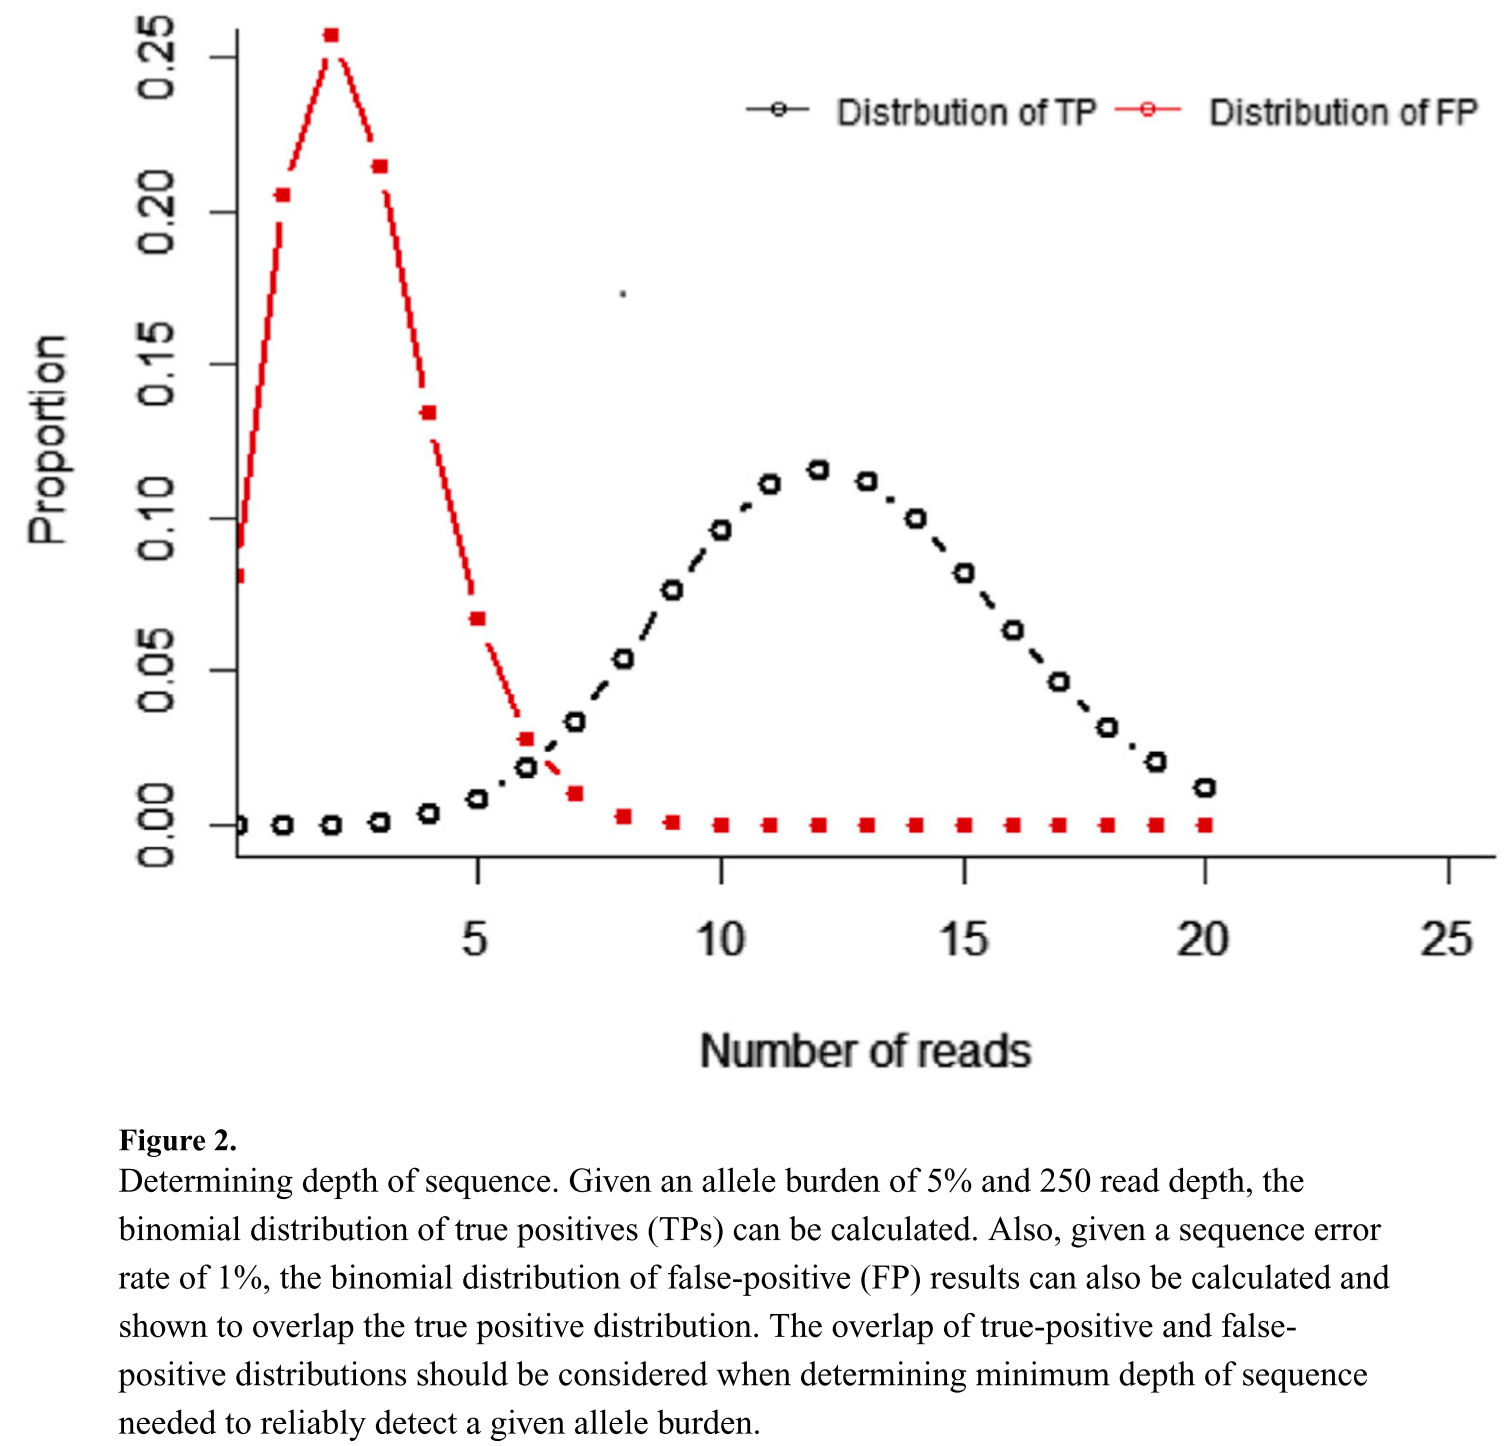
1
2
3
4
5
6
7
8
9
10
11
12
13
14
15
16
17
18
19
20
21
22
23
24
25
26
27
28
29
30
31
32
33
34
35
36
37
38
39
40
41
42library("ggplot2")
Totaldepth=5000 # 预期深度,控制评估的深度上限
ErrorRate=0.004 # 基于产品首批高深度产品,评估获得LOB
LoDRate = 0.01 # 产品预期的检测性能,后期LOD需要单独进行评估补充。
CI = 0.9 # 对性能结果要求的置信区间。
depthlist = c(1:Totaldepth)
ErrorReadNumlist = depthlist
SupportReadNumlist = depthlist
for (depth in 1:Totaldepth) {
ErrorReadNum = round(depth * ErrorRate) # 考虑错误率统计过程中本身已经是错误率的最高值,所以不再进行二项分布扩展。
#ErrorReadNum = qbinom(CI,depth,ErrorRate) # 错误率考虑上95置信区间。
SupportReadNum = qbinom(1-CI,depth,LoDRate)
ErrorReadNumlist[depth] = ErrorReadNum
SupportReadNumlist[depth] = SupportReadNum
}
Difference= SupportReadNumlist - ErrorReadNumlist
type=c(rep(paste('Error:',ErrorRate),times=Totaldepth),rep(paste('Detect:',LoDRate),times=Totaldepth),rep('Difference',times=Totaldepth))
depth=c(depthlist,depthlist,depthlist)
read_num=c(ErrorReadNumlist,SupportReadNumlist, Difference)
data=data.frame(type, depth,read_num)
# ggplot(data,aes(x=depth,y=read_num,cluster=type,color=type))+geom_line()+geom_hline(yintercept = 2)
## 确定目标深度
Target_depth="Not Find "
for(i in Totaldepth:1){
if(Difference[i]<2){
Target_depth = i+1
break
}
}
## 绘图
ggplot(data,aes(x=depth,y=read_num,cluster=type,color=type)) +
geom_line() +
geom_hline(yintercept = 2) +
annotate(geom = 'text',
x= 2000,
y = 30,
label = paste("Totaldepth=5000\nErrorRate=",ErrorRate,"\nLOD-E=",LoDRate,"\nCI=",CI,"\nDepth=",Target_depth,"\ncutoff-E=",qbinom(1-CI,Target_depth,LoDRate) ))
qbinom(1-CI,Target_depth,LoDRate)