测序深度或覆盖深度被定义为覆盖给定核苷酸位置的reads的数量,生物信息学工具极其依赖于足够的覆盖深度,以便灵敏和特异地检测变异。覆盖深度与稳定检测样本的变异之间的关系很简单,因为更高数量的高质量测序数据为特定位置的碱基检测供了信心,无论来自测序样本的碱基调用是否是与参考碱基相同(未识别出变异)或者是非参考碱基(识别出变异)。然而,许多因素会影响所需的深度,包括测序平台,目标区域的序列复杂性(与基因组的多个区域具有同源性的区域、重复序列元件或假基因的存在以及GC富集区域)。此外,用于目标富集的文库制备和需要评估的变异类型也是重要的考虑因素。因此,必须在检测开发和验证过程中系统地评估每个 NGS 测试的覆盖模型。
深度下限(仅考虑检测灵敏性达标)
NGS检测过程中,为了报证临床检测的灵敏性,需要位点深度达到一定水平,才能报证一些低频的变异位点可以被有效的检出。ps:由于该深度仅关注灵敏性,因此针对部分错误富集区域特异性可能并不理想
| 3条/正负支持 | 0.01 | 0.015 | 0.02 | 0.025 | 0.03 | 0.035 | 0.04 | 0.045 | 0.05 |
|---|---|---|---|---|---|---|---|---|---|
| 300 | 49.22% | 74.59% | 88.25% | 94.72% | 97.63% | 98.93% | 99.52% | 99.78% | 99.90% |
| 400 | 67.56% | 88.20% | 95.93% | 98.59% | 99.51% | 99.83% | 99.94% | 99.98% | 99.99% |
| 500 | 80.16% | 94.66% | 98.58% | 99.62% | 99.89% | 99.97% | 99.99% | 100.00% | 100.00% |
| 600 | 88.15% | 97.59% | 99.50% | 99.89% | 99.98% | 99.99% | 100.00% | 100.00% | 100.00% |
| 700 | 93.00% | 98.90% | 99.82% | 99.97% | 99.99% | 100.00% | 100.00% | 100.00% | 100.00% |
| 800 | 95.88% | 99.50% | 99.93% | 99.99% | 100.00% | 100.00% | 100.00% | 100.00% | 100.00% |
| 900 | 97.57% | 99.77% | 99.98% | 100.00% | 100.00% | 100.00% | 100.00% | 100.00% | 100.00% |
| 1000 | 98.56% | 99.89% | 99.99% | 100.00% | 100.00% | 100.00% | 100.00% | 100.00% | 100.00% |
| 4条/正负支持 | 0.01 | 0.015 | 0.02 | 0.025 | 0.03 | 0.035 | 0.04 | 0.045 | 0.05 |
|---|---|---|---|---|---|---|---|---|---|
| 300 | 32.34% | 61.92% | 81.62% | 91.88% | 96.57% | 98.57% | 99.40% | 99.74% | 99.89% |
| 400 | 52.87% | 81.56% | 93.84% | 98.06% | 99.39% | 99.80% | 99.93% | 99.98% | 99.99% |
| 500 | 69.64% | 91.79% | 98.04% | 99.53% | 99.88% | 99.97% | 99.99% | 100.00% | 100.00% |
| 600 | 81.49% | 96.49% | 99.37% | 99.88% | 99.98% | 99.99% | 100.00% | 100.00% | 100.00% |
| 700 | 89.13% | 98.52% | 99.79% | 99.97% | 99.99% | 100.00% | 100.00% | 100.00% | 100.00% |
| 800 | 93.76% | 99.37% | 99.93% | 99.99% | 100.00% | 100.00% | 100.00% | 100.00% | 100.00% |
| 900 | 96.47% | 99.73% | 99.98% | 100.00% | 100.00% | 100.00% | 100.00% | 100.00% | 100.00% |
| 1000 | 98.01% | 99.88% | 99.99% | 100.00% | 100.00% | 100.00% | 100.00% | 100.00% | 100.00% |
| 5条/正负支持 | 0.01 | 0.015 | 0.02 | 0.025 | 0.03 | 0.035 | 0.04 | 0.045 | 0.05 |
|---|---|---|---|---|---|---|---|---|---|
| 300 | 17.56% | 45.21% | 69.91% | 85.59% | 93.72% | 97.43% | 98.98% | 99.60% | 99.84% |
| 400 | 35.69% | 69.85% | 88.91% | 96.47% | 98.96% | 99.70% | 99.91% | 99.97% | 99.99% |
| 500 | 54.24% | 85.47% | 96.44% | 99.22% | 99.83% | 99.96% | 99.99% | 100.00% | 100.00% |
| 600 | 69.78% | 93.59% | 98.93% | 99.83% | 99.97% | 99.99% | 100.00% | 100.00% | 100.00% |
| 700 | 81.18% | 97.33% | 99.69% | 99.96% | 99.99% | 100.00% | 100.00% | 100.00% | 100.00% |
| 800 | 88.79% | 98.92% | 99.91% | 99.99% | 100.00% | 100.00% | 100.00% | 100.00% | 100.00% |
| 900 | 93.55% | 99.57% | 99.97% | 100.00% | 100.00% | 100.00% | 100.00% | 100.00% | 100.00% |
| 1000 | 96.38% | 99.83% | 99.99% | 100.00% | 100.00% | 100.00% | 100.00% | 100.00% | 100.00% |
测算数据下载表1
2
3
4
5
6
7
8
9
10
11
12
13
14
15
16
17supportRead=4 # 支持reads条数下限
depthList=c(300,400,500,600,700,800,900,1000)
freqList=c(0.01,0.015,0.02,0.025,0.03,0.035,0.04,0.045,0.05)
result=""
for (depth in depthList){
for (freq in freqList){
p=0
for (k in supportRead:depth) {
if(!is.nan(choose(depth,k)*((1-freq)**(depth-k))*(freq**k)*(1-0.5**(k-1)))){
p=p+(choose(depth,k)*((1-freq)**(depth-k))*(freq**k)*(1-0.5**(k-1)))
}
}
tmp=paste(depth,freq,p)
print(tmp)
result=paste(result,tmp,sep="\n")
}
}
Establishing Criteria for Depth of Sequencing
一个理想的测序深度,应该是可以有效的对阳性位点和阴性位点进行区分的。而不是单纯的保证灵敏性,忽略假阳性带来的风险。
因此在上述基础上,可以延伸出来一个更为立项的深度预测模型,预先对检测体系进行评估,获得整个检测体系的错误率。然后根据错误率、预期的检测下限和假阳性或假阴性结果的容忍度来估计所需的覆盖深度。(这些性能参数可以并且应该在开发阶段进行评估,以帮助定义验证的接受标准。例如,对于给定比例的突变等位基因,可以使用二项分布方程来确定检测到最小数量等位基因的概率: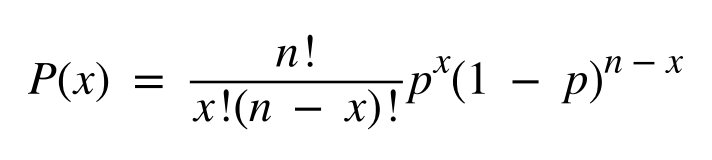
整体方法,和前面的一样,只是在这个部分中,我们需要把错误率(引发假阳性)纳入考量,我们把阳性位点和阴性位点的检出频率分布放到一起,可以得到如下图关系,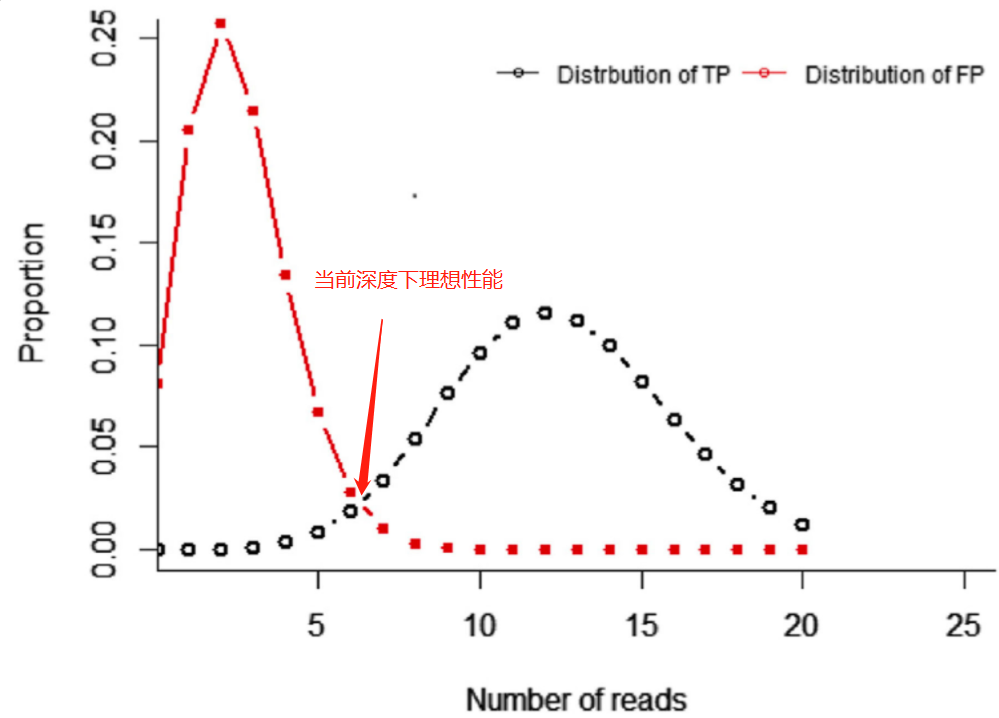
我们要做的,就是寻找一个深度,可以让对应的理想性能的灵敏性和特异性都能满足我们预期的性能需求,为了更好的理解这部分,可以查看动态视图。
1 | library("ggplot2") |
示例结果如下图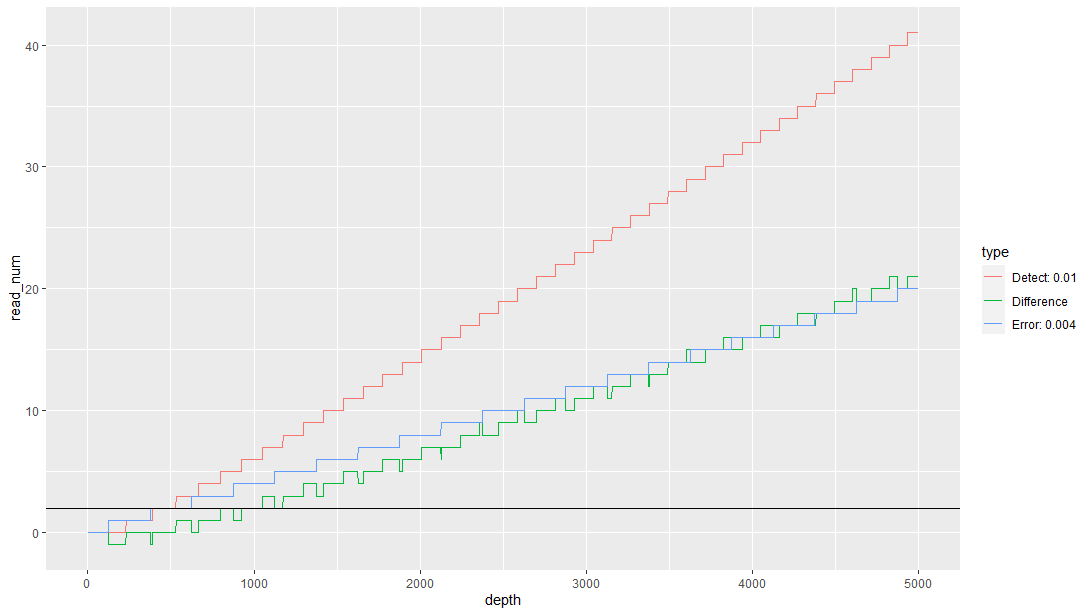
202303补充
《Standardization of Sequencing Coverage Depth in NGS: Recommendation for Detection of Clonal and Subclonal Mutations in Cancer Diagnostics》 发布计算方法和上述介绍原理一致,同时开源了计算代码和在线工具。
参考文献
[1]. Guidelines for Validation of Next-Generation Sequencing-Based Oncology Panels