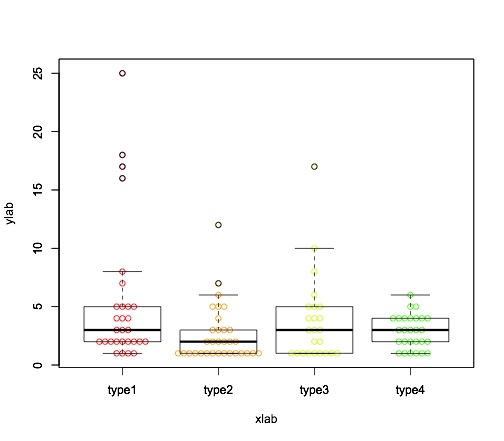
输出结果
绘图命令
1 | bee_plot_with_color("../../Desktop/seqencing depth.csv","xlab","ylab") |
函数代码
1 | bee_plot_with_color=function(In_file,xlab_text,ylab_text){ |
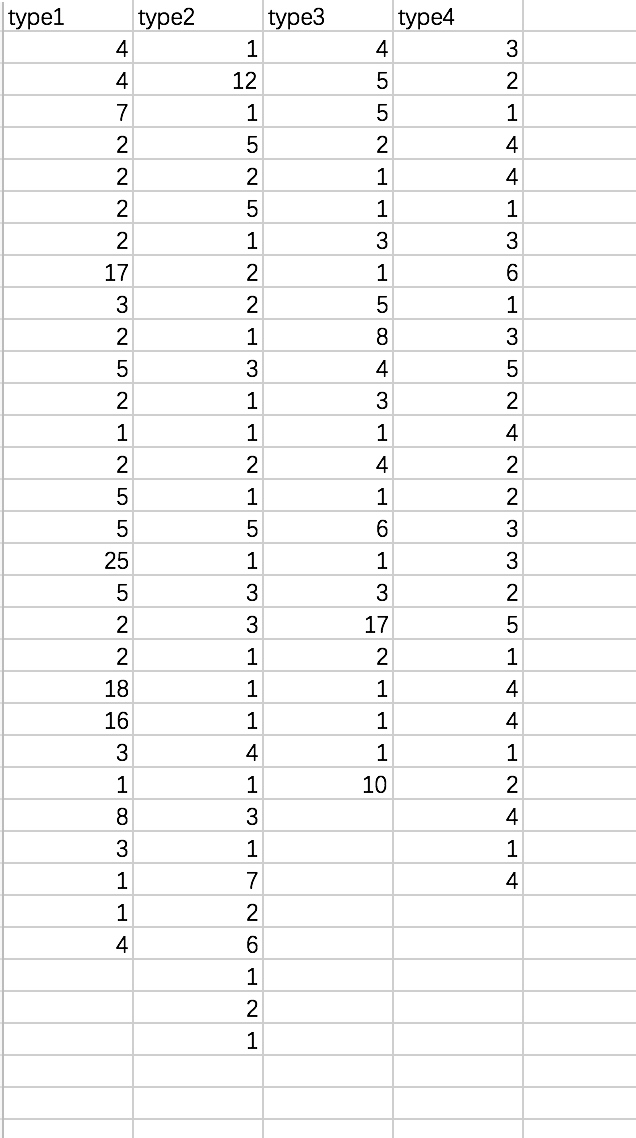
输入文件:
每列对应一类数据,head行,对应类的名称,下面每行是该类的具体数据,最终针对每类数据绘制对应的散点图和4分位图。
1 | bee_plot_with_color("../../Desktop/seqencing depth.csv","xlab","ylab") |
1 | bee_plot_with_color=function(In_file,xlab_text,ylab_text){ |
每列对应一类数据,head行,对应类的名称,下面每行是该类的具体数据,最终针对每类数据绘制对应的散点图和4分位图。