R绘图-ggplot-箱线图绘制

数据处理过程中,好的数据展示,可以帮助我们更好的理解数据,发现数据之间的关系,记录下各种常见的绘图方式。

结果示例

箱线图上方标注的为每个样品对应的中位数,可以根据需要进行调整。
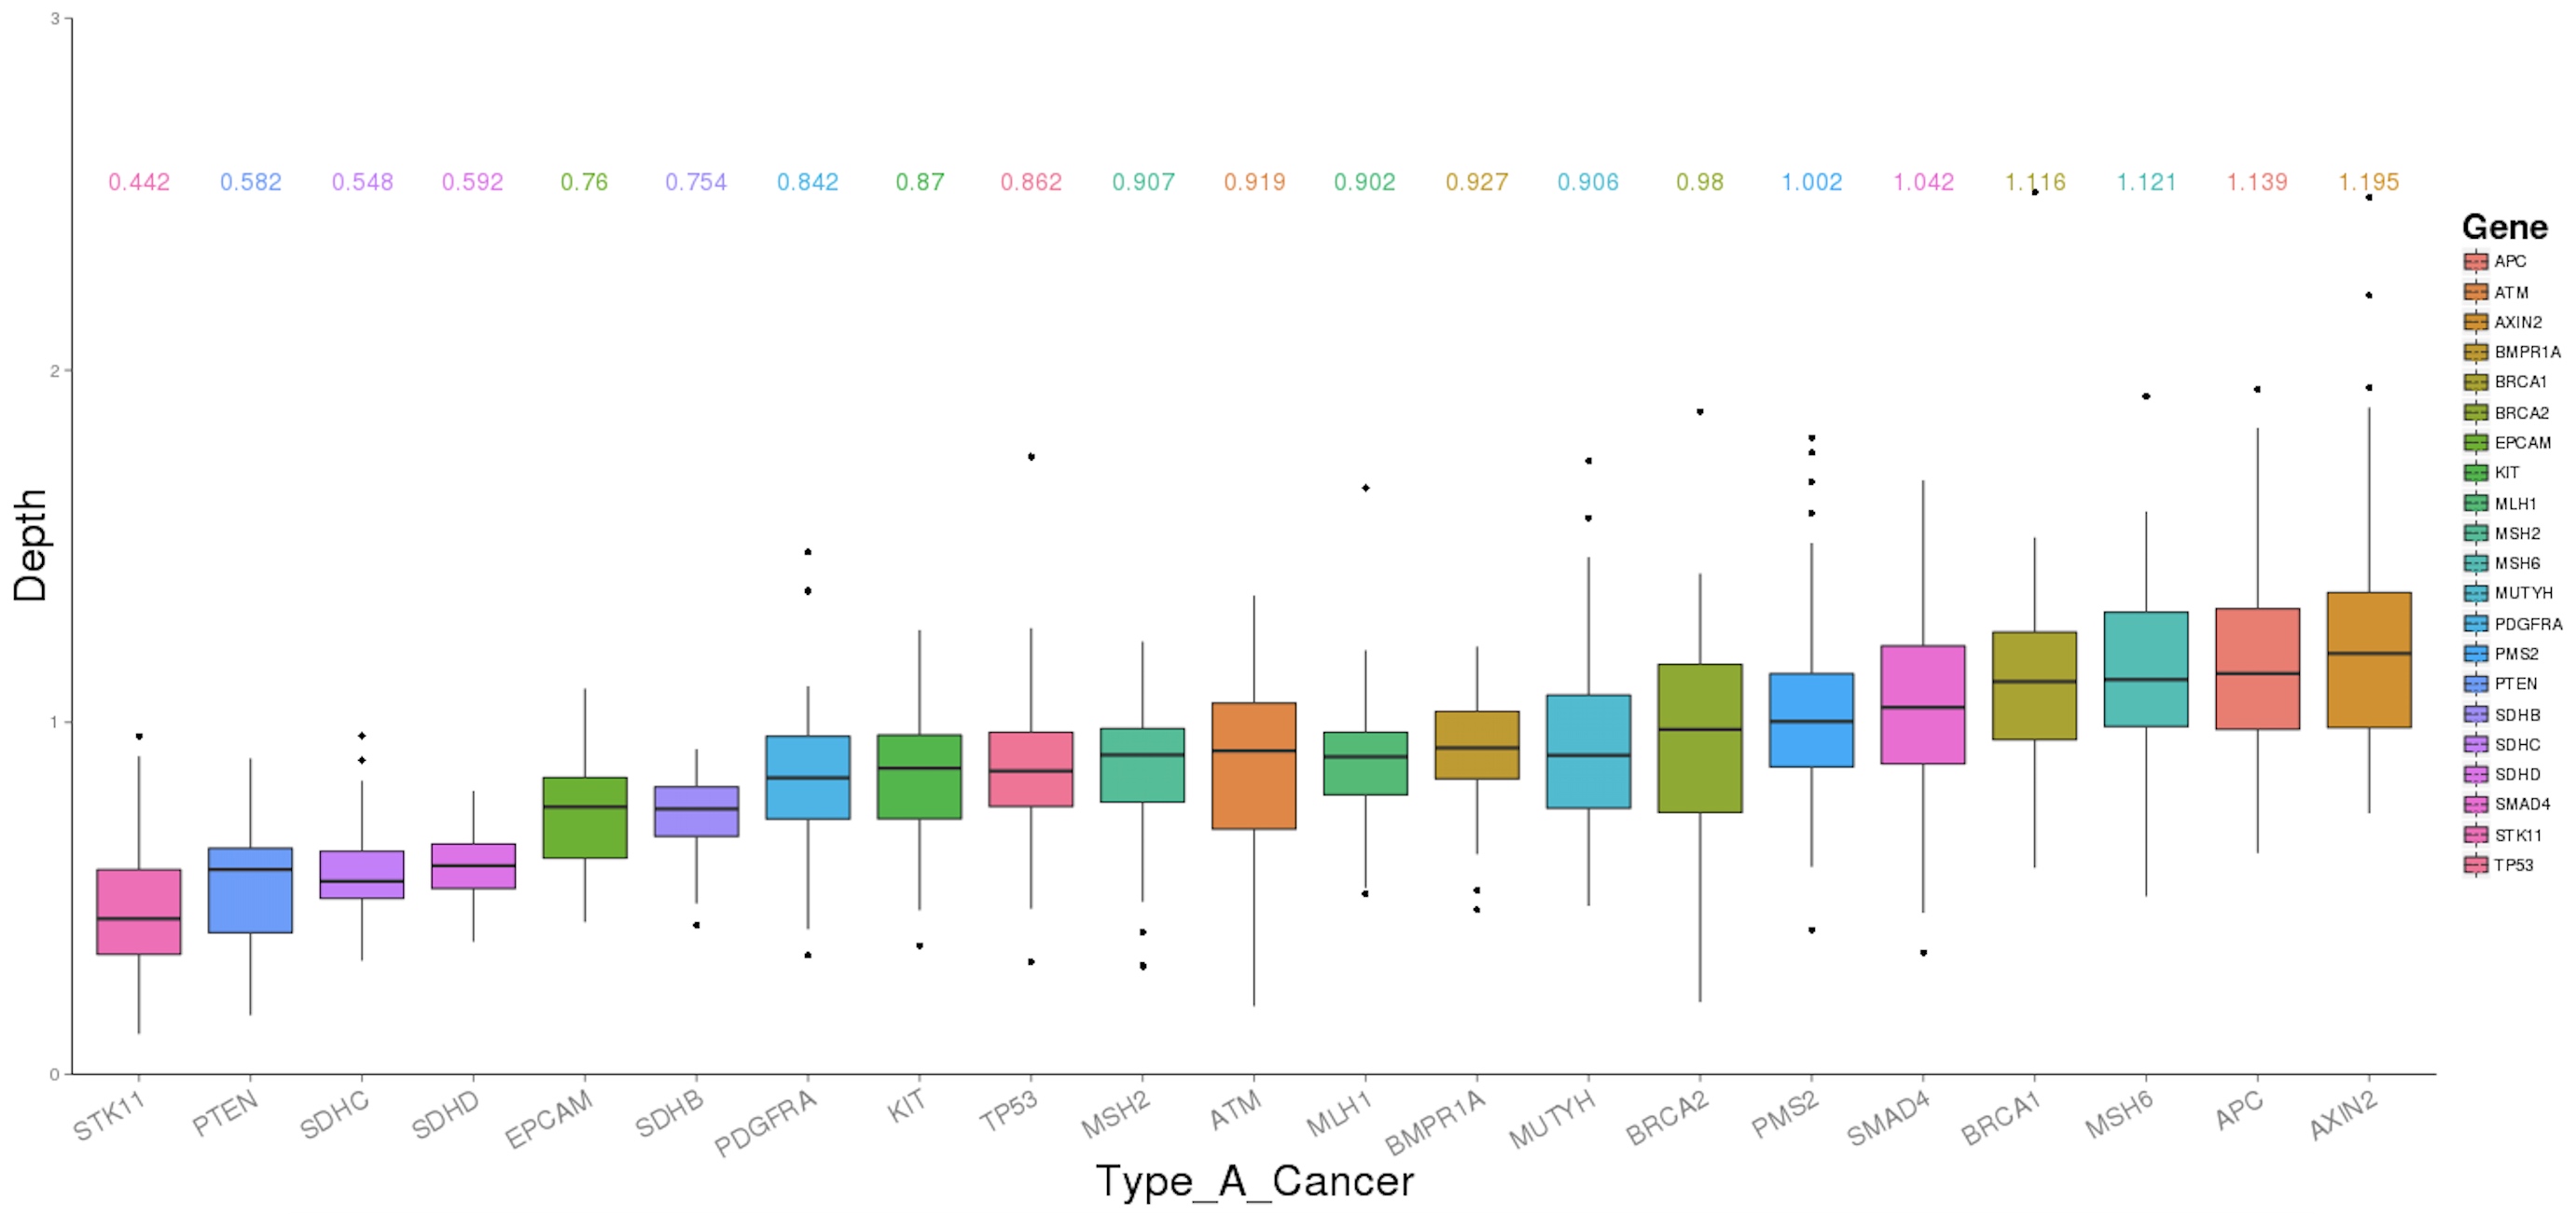
绘图命令

1
Rscript ../ggplot_boxplot.R -i ggplot_boxplot.demo.data -o ggplot_boxplot.demo.data.png -X "gene" -Y "depth"

输入文件

Demo数据
1
2
3
4
5
6
7
8
9
10
11
12
13
14
15
16
17
18
19
20
21
22
23
24
25
26
27
28
29
30
31
32
33
Cluster Value   ID
KIT 0.85192541182175 1
KIT 0.864711404642792 1
KIT 1.12599180249189 1
KIT 0.634586693569092 1
KIT 1.16825284052483 1
KIT 0.68284662568039 1
KIT 0.579859358706082 1
KIT 1.04258938018236 1
KIT 0.753529870275851 1
KIT 0.806402805442452 1
KIT 0.951605801848777 1
KIT 0.941741338875395 1
KIT 0.880335826035274 1
KIT 0.998844046813315 1


BRCA1 1.20329612016347 2
BRCA1 1.16319047052218 2
BRCA1 0.779834117567836 2
BRCA1 0.79095228570136 2
BRCA1 0.835548863196455 2
BRCA1 1.52532474830366 2
BRCA1 1.13679352537476 2
BRCA1 0.598936767501402 2
BRCA1 1.1724422960551 2
BRCA1 0.924227501396964 2
BRCA1 0.691209808851361 2
BRCA1 0.73454091210198 2


程序目录

R脚本
1
2
3
4
5
6
7
8
9
10
11
12
13
14
15
16
17
18
19
20
21
22
23
24
25
26
27
28
29
30
31
32
33
34
35
36
37
38
39
40
41
42
43
44
45
46
47
48
49
50
51
52
53
54
55
56
57
58
59
60
61
62
63
64
65
66
67
68
69
70
71
72
73
74
75
76
77
78
79
80
81
82
83
84
85
86
87
88
89
90
91
92
93
94
95
96
97
98
99
100
101
102
103
104
105
106
107
library('getopt');
library ('ggplot2')
library(MASS)
library(plyr)

#-----------------------------------------------------------------
# getting parameters
#-----------------------------------------------------------------
#get options, using the spec as defined by the enclosed list.
#we read the options from the default: commandArgs(TRUE).
spec = matrix(c(
'help' , 'h', 0, "logical",
'infile' , 'i', 1, "character",
'outfile' , 'o', 1, "character",
'title' , 'T' , 2 , "character",
'x.lab' , 'X', 2, "character",
'y.lab' , 'Y', 2, "character",
'type' , 't', 2, "character"
), byrow=TRUE, ncol=4);
opt = getopt(spec);

# define usage function
print_usage <- function(spec=NULL){
cat(getopt(spec, usage=TRUE));
cat("Usage example: \n")
cat("
Rscript ggplot_boxplot.R -i input_tab -o Demo_out -t png -X xtest -Y ytest -W 100 -H 100

infile format:
Cluster Value ID
Clus_A 0.51 1
Clus_A 0.31 1
.
.
.
Clus_Z 0.42 21
Clus_Z 0.72 21

Options:
--help -h NULL get this help
--infile -i character the input file [forced]
--outfile -o character the prefix for output graph [forced]
--title -T character the Title for the picture (default:Title)
--x.lab -X character the lab for x in SubPlot (default:xlab)
--y.lab -Y character the lab for y in SubPlot (default:ylab)
--type -t character save format(png,tiff,jpeg,svg,pdf default:png)

\n")
q(status=1);
}

# if help was asked for print a friendly message
# and exit with a non-zero error code
if ( !is.null(opt$help) ) { print_usage(spec) }
if ( is.null(opt$infile) ) { print_usage(spec) }
if ( is.null(opt$outfile)) { print_usage(spec) }
if ( is.null(opt$type) ) { opt$type="png" }
if ( is.null(opt$x.lab) ) { opt$x.lab="xlab" }
if ( is.null(opt$y.lab) ) { opt$y.lab="ylab" }
if ( is.null(opt$title) ) { opt$title='Title'}


Args <- commandArgs();
file_tab=read.table(opt$infile,header=F,sep="\t");
out_file=paste(opt$outfile,opt$type,sep=".")
if(opt$type == "png") { png(file=out_file) } #, 400*length(file_tab[1,]) , 400*length(file_tab[,1])) }
if(opt$type == "tiff") {tiff(file=out_file) } #, 400*length(file_tab[1,]) , 400*length(file_tab[,1])) }
if(opt$type == "jpeg") {jpeg(file=out_file) } #, 400*length(file_tab[1,]) , 400*length(file_tab[,1])) }
if(opt$type == "pdf") { pdf(file=out_file) } #, 20*length(file_tab[1,]) , 20*length(file_tab[,1])) }


data=read.table(opt$infile ,header=T)
data2=ddply(data,"Cluster",summarise,Median=round(median(Value),3))
ggplot(data,aes(x=reorder(Cluster,Value),y=Value,fill=Cluster)) +
geom_boxplot() +
theme(panel.grid.major =element_blank(), panel.grid.minor = element_blank(), panel.background = element_blank(), axis.line = element_line(colour = "black"),axis.title.x=element_text(size=25), axis.title.y =element_text(size=25), title=element_text(size=25), axis.text.x=element_text(angle=30,hjust=1,size=15))+ #设置x轴,数据标签的样式
labs(x=opt$x.lab ,y=opt$y.lab) + # 设置x轴和y轴现实的标注
geom_text(data=data2,aes(x=Cluster,y=2.5,colour=Cluster,label=Median,vjust=-0.2)) + # 在y=2.5的位置添加标签批注
coord_cartesian(ylim=c(0,3)) # 对绘制的图片 根据x轴和y轴进行截取

####
#ggplot(data,aes(x=reorder(Cluster,Value),y=Value,fill=Cluster)) +

### 绘图类型 ###
#geom_boxplot() + # 绘制箱线图

### 样式 ###
#theme(panel.grid.major =element_blank(), # 去除主网格线
#panel.grid.minor = element_blank(), #去除次网格线
#panel.background = element_blank(), #去除背景色(默认为灰色)
#axis.line = element_line(colour = "black"),#将x轴和y轴的框线设置为黑色
#axis.title.x=element_text(size=25), #设置x轴的标题样式
#axis.title.y =element_text(size=25), #设置y轴的标题样式
#title=element_text(size=25), #设置主标题样式
#axis.text.x=element_text(angle=30,hjust=1,size=15)) + #设置x轴,数据标签的样式

### 设置坐标轴标注 ###
#labs(x=opt$x.lab ,y=opt$y.lab) + # 设置x轴和y轴现实的标注

### 添加标签 ###
#geom_text(data=data2,aes(x=Cluster,y=2.5,colour=Cluster,label=Median,vjust=-0.2)) + # 在y=2.5的位置添加标签批注

### 对图片进行截取 ###
#coord_cartesian(ylim=c(0,3)) # 对绘制的图片 根据x轴和y轴进行截取
dev.off()
-------------本文结束感谢您的阅读-------------